How Airtight Is the Average Australian Home?
CSIRO put a real number on it in 2024 — 233 new homes, five cities, one blower door. Here's what it found.
“Average” gets thrown around a lot in airtightness marketing, often without a source. In 2024, CSIRO published the closest thing Australia has to a real answer: a blower door study of 233 newly built homes across five capital cities. Here’s exactly what it measured, what it found, and — importantly — what it doesn’t tell you.
10 min read
Key takeaways
- CSIRO's 2024 “Air Infiltration of New Dwellings in Australia” report blower-door tested 233 new homes in Melbourne, Sydney, Brisbane, Canberra and Adelaide.
- The national average result was 6.86 m³/h/m² (q50) — apartments averaged 5.8, single-storey houses 6.8, and two-storey houses 8.5.
- This study covered new dwellings only. It says nothing directly about the existing housing stock, which is widely understood to leak considerably more.
- Some individual homes in the sample tested above 17 m³/h/m² — well over double the average, and above the NCC 2022 air permeability benchmark of 10 m³/h/m².
- A national average masks a wide spread. The only way to know where your specific home sits is to test it.
Jump to a section
1. The headline number
The average newly built Australian home in CSIRO’s 2024 sample leaked at 6.86 m³/h/m², expressed as q50 — airflow at 50 Pascals per square metre of building envelope. That’s the figure now circulating in industry articles, NatHERS documentation and building science commentary as “the average Australian home.” It’s a genuinely useful number, but it comes from a specific, bounded study — not a census of every home in the country.
2. What CSIRO actually tested
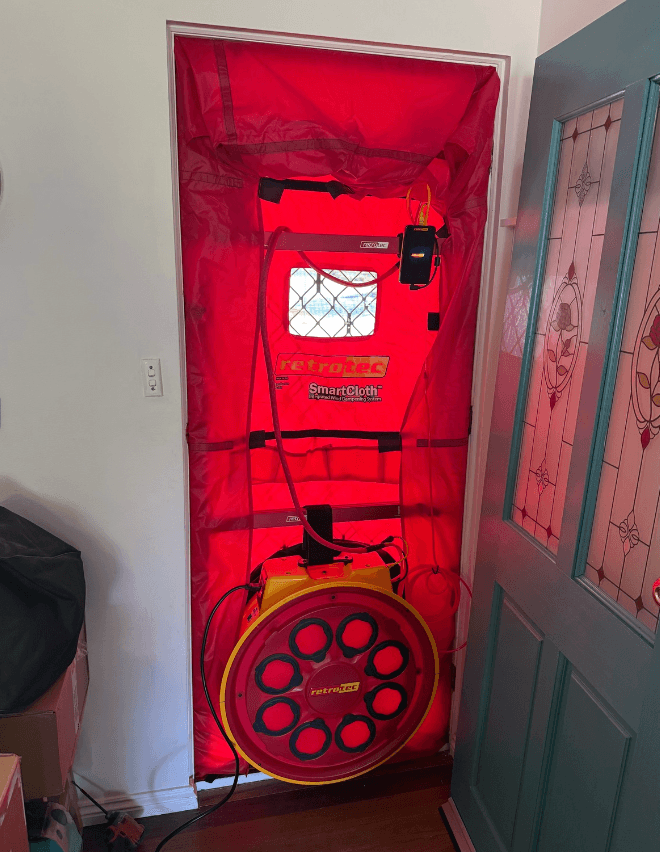
CSIRO’s Air Infiltration of New Dwellings in Australia report, published in 2024, blower-door tested 233 newly built dwellings across Melbourne, Sydney, Brisbane, Canberra and Adelaide. Each home was tested using the same blower-door method described in our blower door testing service: a calibrated fan pressurises or depressurises the building to 50 Pascals, and the airflow required to hold that pressure is recorded.
Why this study matters
Before this report, “average Australian airtightness” figures circulating in industry conversation were largely estimates or drawn from small, informal samples. This is a genuinely large, methodologically consistent, multi-city dataset — a real benchmark rather than a guess.
3. Results by dwelling type
Apartments
Lowest average — shared walls reduce exposed envelope area
Single-storey houses
Close to the national average
Two-storey houses
Highest average — more junctions and penetrations
National average (all types)
Reported headline figure
Two-storey homes came out leakiest on average — more envelope junctions, longer service and stair penetrations, and more opportunities for the air barrier to be broken. Apartments came out tightest, largely because shared party walls reduce the amount of exposed envelope being tested. Some individual homes in the sample tested well above 17 m³/h/m² — more than double the national average, and a reminder that a headline average always hides a wide spread of real results.
4. New builds vs older, existing homes
This is the distinction that gets lost when the CSIRO figure is quoted loosely: the study tested newly built homes only. It doesn’t measure — and shouldn’t be used to describe — the airtightness of Australia’s much larger stock of older existing homes.
Industry experience strongly suggests older homes leak considerably more, though there isn’t yet an equivalent large-scale Australian study of existing housing stock to put a precise national figure on it. What we can offer is a real, documented example: a pre-renovation blower door test on an existing home at Nairne, in the Adelaide Hills, measured combined leakage of 1,149 cm² — equivalent to a single round hole roughly 38 cm across, noticeably bigger than an A4 sheet of paper. That’s one untested, untreated older home, not a national average — but it illustrates why “typical existing home” and “typical new home” shouldn’t be treated as the same number.
HiPer Haus field note
In our own testing across Adelaide and South Australia, we regularly see new homes land close to the CSIRO averages above — and regularly see individual homes well outside them in both directions, depending on how carefully the air barrier was detailed and sequenced during construction. See common air leaks found during blower door testing for the specific spots that tend to explain the difference.
5. How this compares to NCC 2022
NCC 2022’s air permeability performance requirement, used in the airtightness verification pathway, is 10 m³/h/m². The CSIRO national average of 6.86 sits comfortably under that line — but averages don’t certify individual buildings. A meaningful share of homes in the CSIRO sample tested above 10 m³/h/m², including some over 17.
NCC 2022 H6V3 uses measured air permeability within an optional building-envelope sealing Verification Method and requires mechanical ventilation when its threshold is met. This is not a universal 5 ACH50 trigger. See NCC 2022 ventilation requirements and the South Australian compliance guide for how that plays out in practice.
6. A quick note on ACH50 vs q50
CSIRO reported its results as q50 (m³/h per m² of envelope area), not ACH50 (air changes per hour, based on internal volume). They measure the same underlying leakage but aren’t interchangeable without knowing a building’s specific volume-to-envelope-area ratio — which varies with ceiling height, floor count and building shape. Passive House certification uses ACH50 (≤0.6); NCC 2022’s airtightness verification pathway uses q50. For the full explanation, see What is ACH50?
Why we haven’t converted CSIRO’s figures to ACH50 here
A rough conversion is possible for a “typical” house shape, but it introduces assumptions the original study didn’t make. Every HiPer Haus test report includes both ACH50 and q50 for your actual building, calculated from its real measured volume and envelope area — the only way to make a genuinely accurate comparison.
7. Where does your home sit?
National averages are a useful reference point, but they can’t tell you anything about your specific home. Whether you’re building new and want to check your construction approach is on track, or you own an older home and want a real baseline, a blower door test is the only way to replace “probably average” with an actual measured number — and to find out exactly where any leakage is coming from.
Related tools
Want your home’s real number, not just a national average?
Get an instant quote →Frequently asked questions
What did the 2024 CSIRO airtightness study measure?
CSIRO blower door tested 233 newly built homes across Melbourne, Sydney, Brisbane, Canberra and Adelaide, and reported results as q50 — air leakage in m³/h per m² of building envelope at 50 Pascals.
What was the average result?
The national average across the sample was 6.86 m³/h/m² (q50). Single-storey houses averaged 6.8, two-storey houses averaged 8.5, and apartments averaged 5.8.
Does the CSIRO study cover older, existing homes?
No. The 2024 sample was 233 newly built dwellings only. Older existing homes were not part of this study and are generally understood in the industry to leak considerably more, though there isn't an equivalent large-scale Australian dataset for existing housing stock.
How does this compare to the NCC 2022 verification pathway?
NCC 2022 H6V3 verifies building-envelope sealing at not more than 10 m³/(h·m²) at 50 Pa when that optional pathway is used. The CSIRO average of 6.86 was below that value, but individual homes varied substantially. This comparison does not mean every home in the study was assessed for NCC compliance.
Is q50 the same as ACH50?
No, though they measure the same underlying leakage. ACH50 divides the leakage rate by internal volume; q50 divides it by building envelope surface area. The two aren't directly interchangeable without knowing a building's specific volume-to-envelope-area ratio.
Why did two-storey homes leak more than single-storey homes?
Two-storey homes have more envelope junctions, longer service runs, and additional penetrations such as stairwells and upper-floor cavities — more opportunities for gaps in the air barrier.
What does my own blower door result mean next to these averages?
A result well under the CSIRO average suggests better-than-typical detailing. A result above it suggests there are findable, sealable leaks — a smoke-pencil investigation during testing will show you where.
Is a leakier-than-average new home a building code failure?
Not automatically. NCC 2022 does not set a nationwide maximum ACH50 result for every pathway. Its H6V3 building-envelope sealing Verification Method uses air permeability in m³/(h·m²), not ACH50. The result must be assessed against the project's approved pathway and specification.
Related articles
Find out where your home actually sits
Book a blower door test with HiPer Haus and get a real, measured result — plus leak-hunting to show you exactly where any leakage is coming from.
Written by
Jonathen HindryFounder of HiPer Haus. ATTMA Level 1 Airtightness Tester, Certified Passive House Tradesperson and 25+ year plumber — blower door testing, MVHR design and heat pump hot water across Adelaide and South Australia.
